Growing mobile games through user acquisition
Nordeus' Andrej Kugonič takes a deep dive into UA for the GamesIndustry.biz Academy
User Acquisition (UA) is a marketing discipline that is extremely important for app growth today. Whether your product is a food delivery app or mobile game, the quickest and most effective way to (profitably) enable growth is to invest in UA.
It is an ongoing process which never stops and can last for years. At Nordeus, we are still investing in UA for our flagship game Top Eleven -- Be a Football Manager, which is actually celebrating its tenth birthday in May.
UA is a process of acquiring new users through different marketing channels, with the main objective being long-term profitability. It is done with all standard performance marketing principles, but with one clear goal: maximum growth with positive ROI (return on investment).
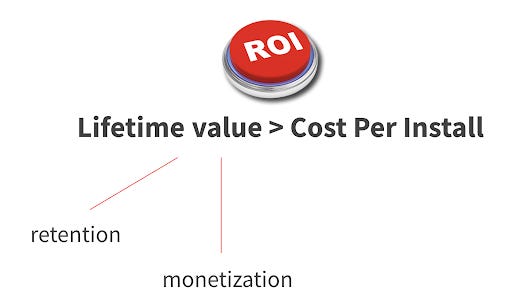
On one side you have a cost per install (CPI) for each user installed through your campaigns, and on the other side you have (predicted) lifetime value of acquired users (LTV). LTV is a combination of retention (how long people stay in your app) and monetization (how much they spend in your app, plus in-app advertising).
The main objective is to have your lifetime value superior to your cost per install, and you will have positive ROI.
Main areas and channels in user acquisition
Some of the main areas in User Acquisition are:
- Data analysis
- Making actionable reports out of available data
- Understanding results and making hypothesis based on data
- Making decisions based on data (investment, etc.)
- Modeling LTV/ROI projections
- Media buying
- Traditional and digital media channels buying
- Creative
- Understanding ads performance with detailed and actionable reports
- Briefing and partnering with creative teams for next iterations of ads
- Deep business/industry knowledge
- Competition tracking
- Industry tracking and trends
Channels in UA have huge variety, but with strong share from the Facebook and Google duopoly:
- Social networks (Facebook, Instagram, Twitter, Snapchat, TikTok, etc.)
- Search (Apple Search Ads, Google Play Search and Google Search)
- Various video networks
- Various demand-side platforms
- Influencers
- Traditional channels to some extent (TV, etc.)

Scaling user acquisition
Today, there are a few interesting questions that are always present -- especially when launching a new game or app -- and are not easy to answer if you are responsible for UA budgets:
- How can we measure CPIs on a different scale?
- What is the maximum and minimum scale and CPI?
- How much can we grow a game/app with UA and scale our budgets and installs?
Let's start with the first two questions.
The mobile gaming landscape is constantly changing year-on-year and so is advertising. It is becoming more and more sophisticated, which is great, but this can give us some headaches when trying to measure success and make plans for new products or make plans for the next year for live products.
The mobile gaming landscape is constantly changing year-on-year and so is advertising
Before new algorithms, it was much easier to measure results. Almost all traffic (except incentivized) was of a similar quality (LTV) in one country. Today, with new advertising optimization methods on Facebook, Google and other platforms, we can see big differences in terms of quality of users (LTV) and price per user (CPI).
These days, CPI increases based on different budget levels (and maximum/minimum CPI), and can be represented only if you look at it on a specific level of granularity. That means it needs to be the same country, same UA channel, same optimization method, and the same platform. Why? Overall CPI on a wide global UA scale depends on many factors:
- 1. Country share
In which countries do you spend the most money and where do you get the most installs?
- 2. Platform share
Android vs. iOS? (in most countries iOS is usually more expensive)
- 3. Channels used
On which channels do you advertise the most? (Facebook, Instagram, Google ads, Apple Search Ads, Video Networks, etc.)
For example, users in the US can cost $3 on Google and $5 on Facebook and $1.50 on Video Networks, depending on various reasons, mostly targeting and which algorithms they have. All of them will also have different qualities of users.

- 4. Optimization methods
This is an extremely important part. Are you mostly optimizing towards the cheapest possible installs (app install optimization), or chasing payers (app event optimization), or maybe for higher-value users (value optimization)? Usually, the best way is a mix of all, but the share of methods can make a big difference in CPI/LTV.
Chasing quality users with the best price is now a much better strategy to go with
For example, on Facebook/Instagram in the US for some apps, using mobile app install optimization you can get a user for $2, with app event optimization you can get a user for $8, and with value optimization it can be even $15. And, maybe, the best results (ROI) will be on VO campaigns even though they are the most expensive. The days when chasing the lowest possible CPI was the best UA strategy are behind us. Chasing quality users with the best price is now a much better strategy to go with.
- 5. Scale
How much are you pushing with a daily scale of budget/installs on the country/platform/channel level? This part will be covered below in a more visual style.
- 6. Seasonality
Q4 is usually the most expensive period, while summer months and January/February are cheapest.
The pressure of competition on a specific target group can impact CPI a lot if we are looking at CPIs with a wider view, in the context of different genres in the whole gaming industry.
For example, let's take the US as a market, Facebook as a channel, optimization for app events (AEO for purchases), and Android as a platform, and leave only scale as a variable to show how metrics will behave -- see picture below.
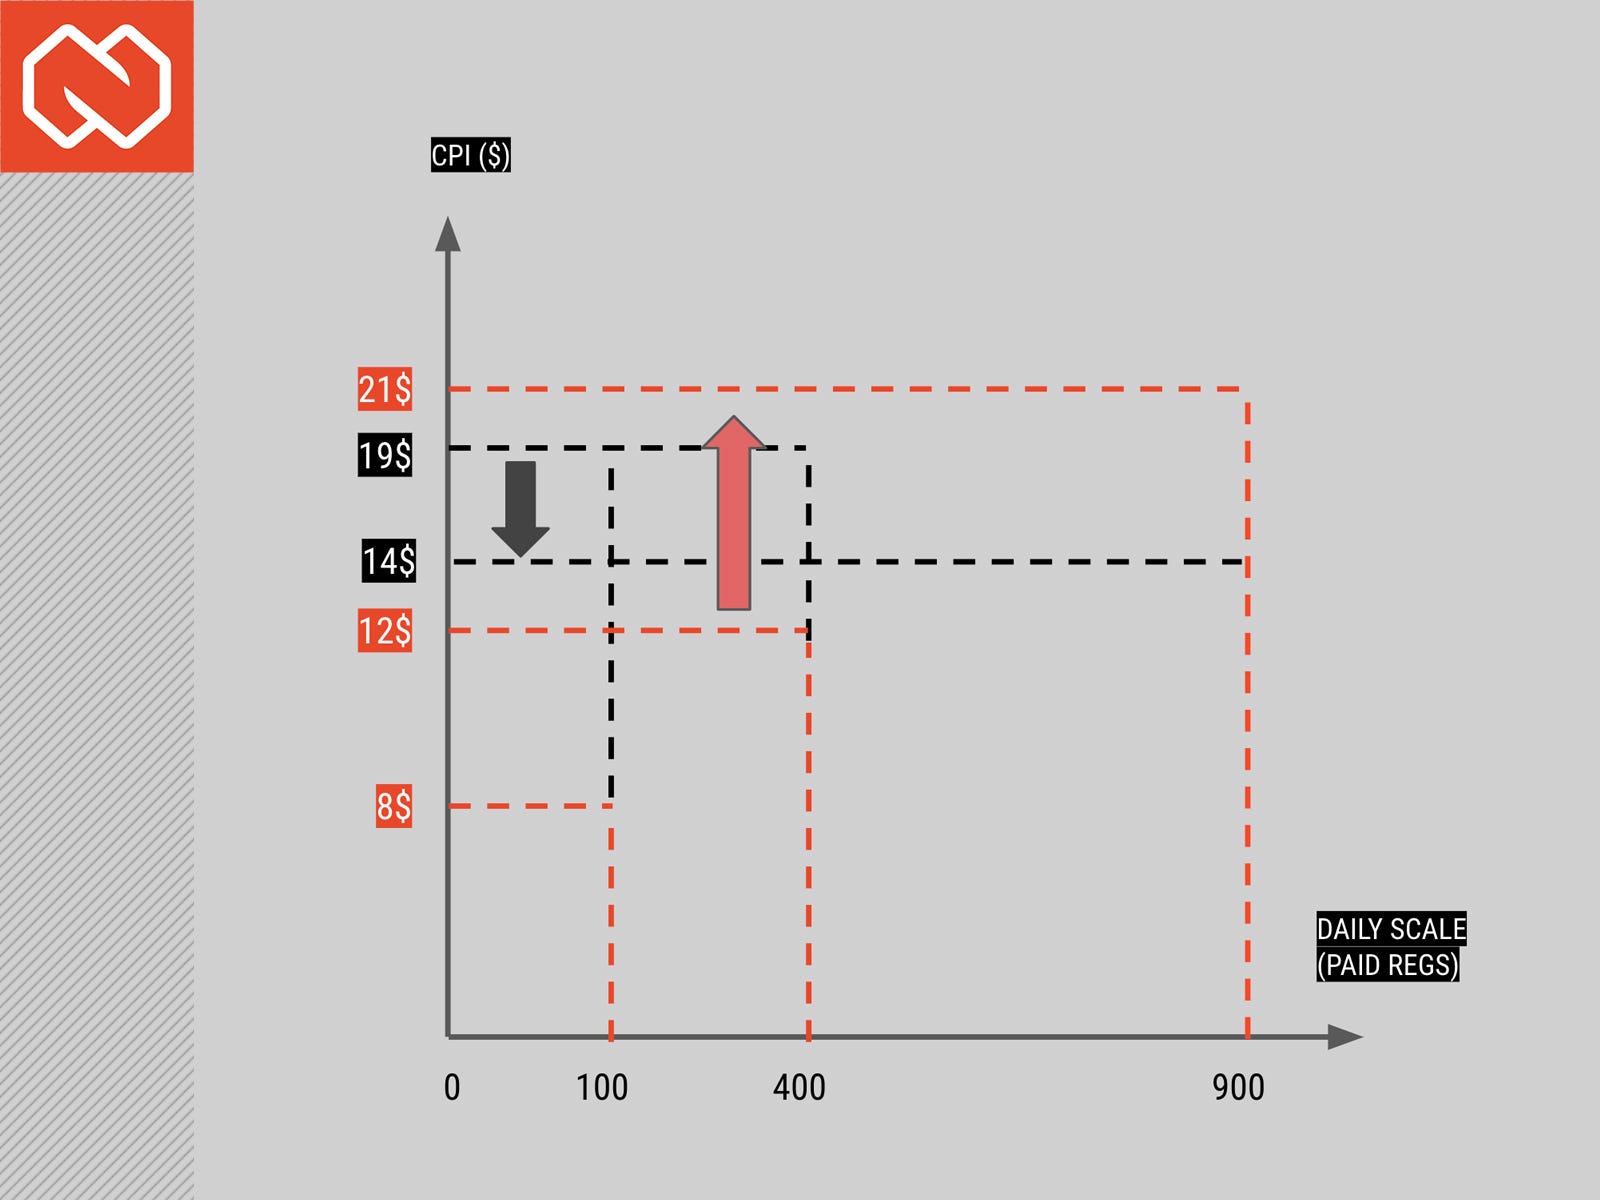
In this graph, The X axis is Daily Scale, which means a number of registrations/installs we get daily from UA campaigns, and the Y axis is the CPI in dollars. The red line is showing expected CPI values on a different daily scale and the black line expected LTV values with a specific scale.
There are three different levels of scale in this scenario which I will try to explain now:
- 1. Low scale (100 daily installs)
- CPIs lowest ($8) and highest quality of users (LTV is $19)
- Here, we are acquiring best quality users from the most narrow/relevant targeting (high LTV) without over pushing algorithms (low CPI)
- 2. Medium scale (400 daily installs)
- CPIs increase ($12) because of higher pressure with budgets on algorithms
- In this scenario, we will get more installs with similar LTV ($19)
- Is this better than a low scenario? Probably yes, because we will have much more users with lower ROI threshold, which in total will mean more profit
- 3. High scale (900 daily installs -- maximum potential scale)
- CPIs highest ($21) because we are pushing our target audience to the limits
- But in this case, even LTVs can potentially decrease ($14) because we need to widen our target audience to less relevant audience to get the maximum scale of users
One part of the UA job is finding the sweet spot between scale and profitability
As we can see from the above, one part of the UA job is finding the sweet spot between scale and profitability at this level of granularity, to get maximum profit from budget spent and not to miss any revenue opportunities.
It's worth noting that CPIs are also highly dependable on creatives, but in the above graph I simplified things for a better understanding of how daily scale can impact CPIs, LTVs, and eventually ROI.
Growth through user acquisition on a big scale
Now that we have covered the basics above, in the next part I will connect it with a high-level picture of growth to answer the next question from the list: How much can we grow our budgets and installs from UA and scale?
When you see a good performance on a lower scale -- for example, in a soft launch test campaign -- and then you want to go big, you will spend money worldwide (countries, channels, platforms). CPIs can vary a lot and obviously LTVs with them, even on a country level.
Because of that, there is actually only one important correlation for growth which can be shown visually and talked about when you are increasing UA on a big scale, and that is budget versus expected ROI -- see picture below.
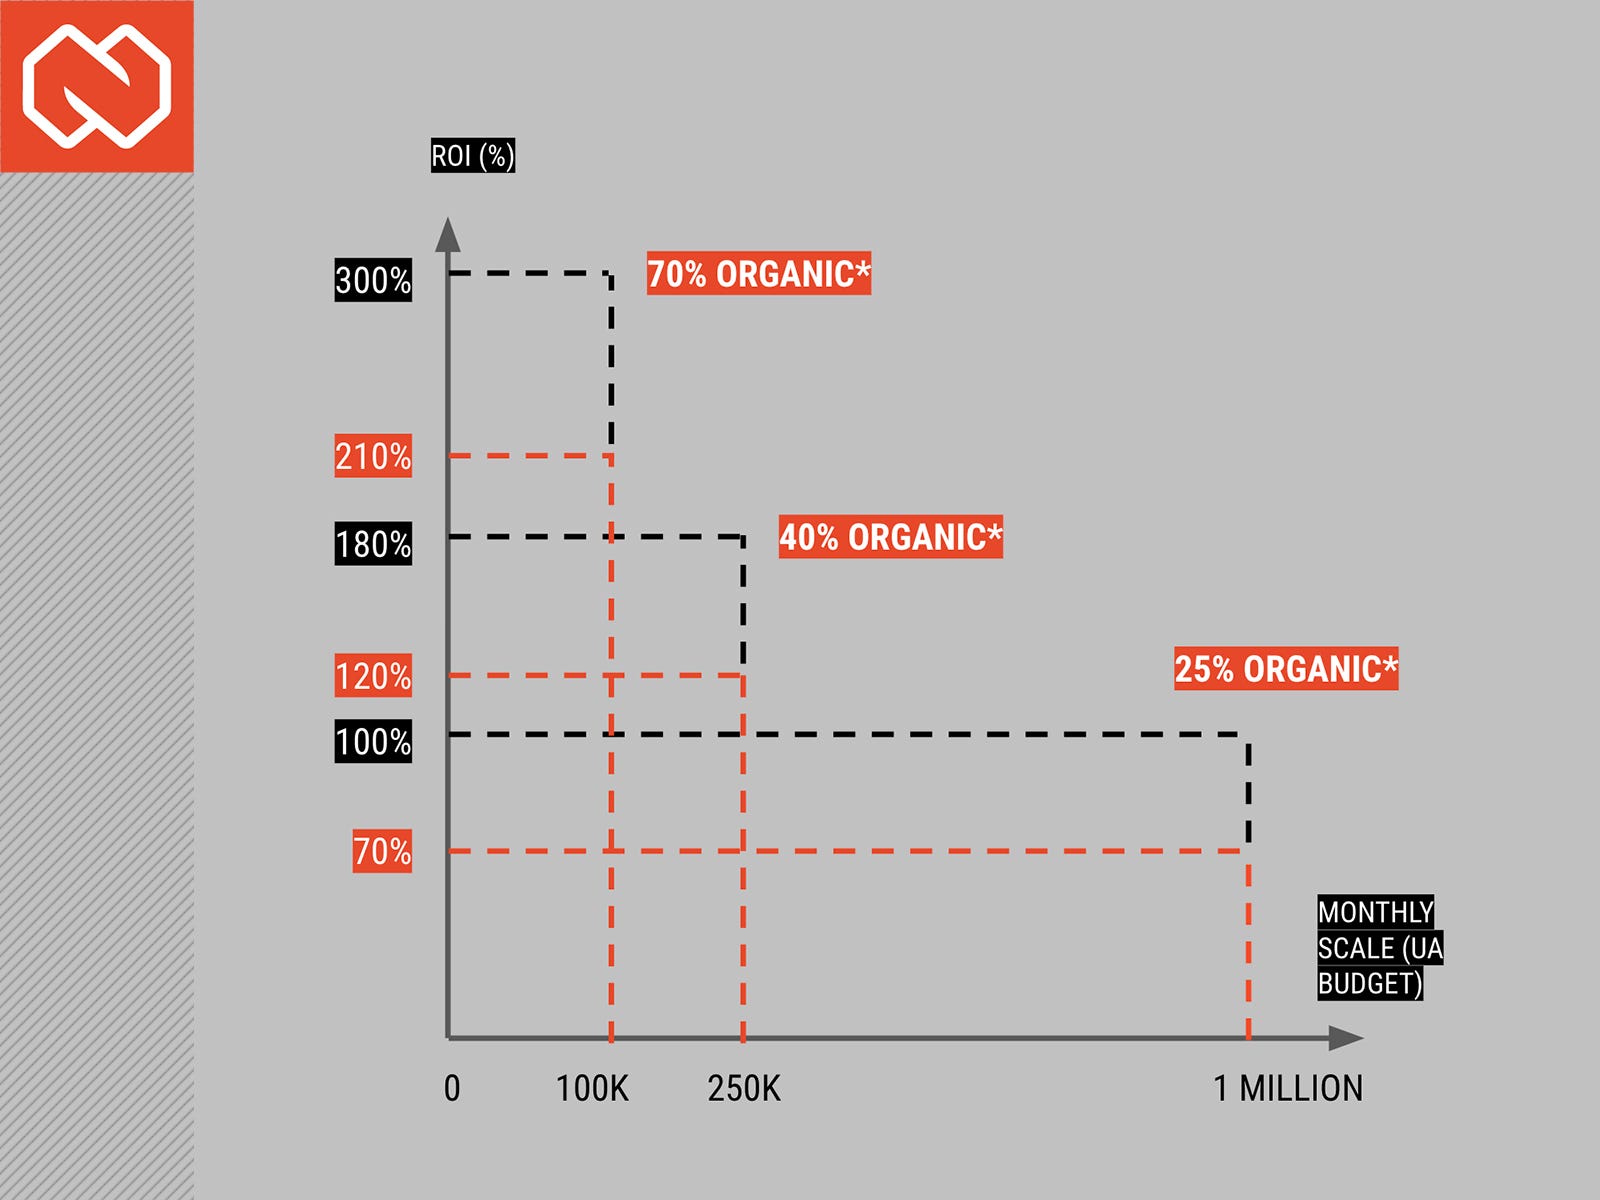
In this graph, the X axis is the Monthly Scale, which means the monthly UA budget, and the Y axis is ROI in percent. The Percentage of organic in the graph is the share of organic installs in overall installs for different scales -- this share usually decreases when we increase UA budgets and installs.
The red line is showing expected paid ROI values on a different monthly scale (budgets), and the black line is expected ROI (both Organics and Paid revenue) values with a specific scale.
As I explained before, CPIs and LTVs today can vary so much based on many different factors and there is no way to predict their correlation doing large scale UA with high level of accuracy. That is why you need to try to find the correlation between ROI and budget (referred here as Scale) to find the sweet spot.
Ideally, if you had a lot of tests to see how the ROI curve behaves -- Google Ads campaigns, different countries, optimization methods, targetings, etc. -- that would help you make decisions for growth investment. But if not, you will need to rely on many educated guesses, tests, and assumptions based on your experience and knowledge to make the best strategy and then still go very carefully with ROI/LTV modeling and thresholds.
In the graph above, there are three different levels of scale (monthly budget) in this scenario:
- 1. Low-scale ($100,000 monthly budget)
- We have 210% paid ROI, which means getting back our whole investment plus earning an additional 110% on top from only paid installs
- Share of organic installs is on the highest level on this scale
- With organic installs/revenue, we will have around 300% eROI on this scale
- You may be wondering how come we have only 300% eROI with two times more organics than paid. Should it be much more than 300%? On a low scale, usually, UA is going to acquire only the best quality users to have the most profitable campaigns, and those users have much higher LTVs than Organic traffic
- 2. Medium-scale ($250,000 monthly budget)
- 120% ROI from paid UA would be achieved on this scale
- As we scale up paid UA, the share of organic installs is dropping (to i.e. 40%)
- That 120% paid ROI will be increased with revenue from organic installs, so the achieved eROI is around 180%

- 3. High-scale ($1 million monthly budget)
- We would have only a 70% ROI from paid UA in this scenario, which means we are losing 30% of our investment
- Even with revenue from organics, eROI would not go over 100% (break-even)
- In this scenario, the quality of organic installs is much more similar to paid installs, because on a big scale we target and acquire a much wider audience, and that will decrease LTVs of paid users and make them more similar to organic installs
- With this budget, we would have probably only a 25% share of organics in total installs
In this example, the sweet spot is probably somewhere between low and medium scenarios to earn the most profit, probably with a budget of around $150,000 to $200,000. This scenario is not the best to have because it is a very low UA budget for industry standards for successful mobile games, which commonly have seven digit numbers for UA budget unless they have huge organic growth.
Key takeaways
To conclude, here are the main things you should remember from this article:
- CPIs and LTVs on a scale can be precisely measured only on a specific level of granularity
- The best strategy for profitable growth from UA is aiming for "quality users" and not the cheapest ones
- Finding a sweet spot between scale and profitability is becoming one of the most relevant and hardest tasks, especially for new products
- Only one important correlation for growth should be talked about when you are scaling UA on a big scale: budget versus expected ROI
- As you scale UA budgets, at some point both ROI and eROI will start going down
- Understand the potential and limits of the market niche you are in, analyzing key competitors, gathering insights from key partners like Google, Facebook, peers, etc.
Andrej Kugonič has worked on digital performance marketing campaigns and strategies on many global brands. He is currently responsible for leading the User Acquisition team and growth activities for all Nordeus games with a big focus on flagship game Top Eleven as well as new, live mobile game Heroic.