See the game platforms and genres generating the highest user spending
Newzoo shares revenue insight across console and PC platforms
We recently added US revenue data for console and PC games to Newzoo Expert, so we thought we’d share some high-level data and insights, focusing on in-game ARPPU (average revenue per paying user) and ARPU (average revenue per user) per title for PlayStation, Xbox and PC.
As readers of Newzoo's Global Games Market Report will know, game companies have diversified their revenue streams via an array of monetization tactics. This includes not only full-priced premium games, but also DLC, free-to-play monetization and subscriptions.
Revenue data in the US market: PC payers tend to spend a little more in-game
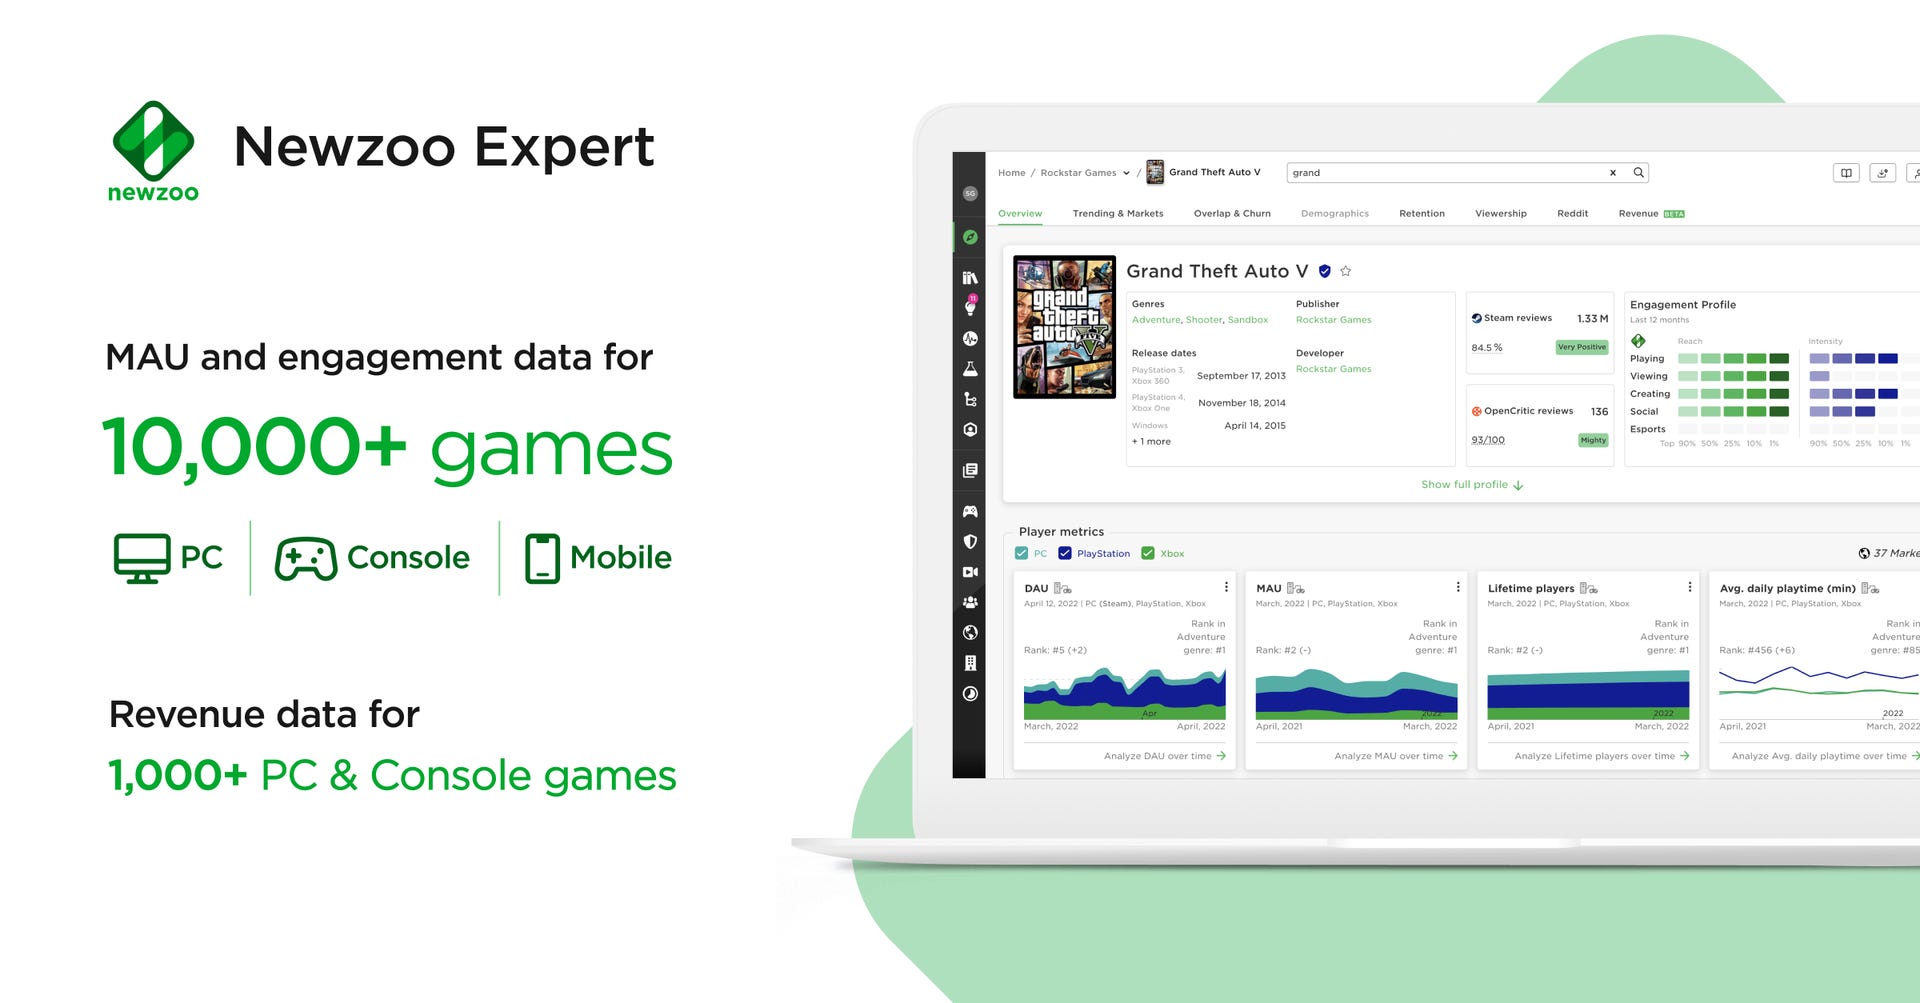
Luckily, our revenue data for the US includes metrics like total revenues, ARPU and ARPPU. We even split out revenue streams like DLC, microtransactions and subscriptions. All this data is available by game, platform (PlayStation, Xbox and PC) and genre in our Newzoo Expert platform.
This data is already helping game developers benchmark their game’s performance, forecast game launches and hone their monetization strategy.
First, let’s answer the question: What do ARPU and ARPPU mean in games?
- ARPU (average revenue per user) is the average in-game spend on a game for the selected time period per active user (recurring revenue only).
- ARPPU (average revenue per paying user) is the average in-game spend on a game for the selected time period per paying user (recurring revenue only).
Our revenue data for the first nine months of 2022 shows that the monthly ARPPU per title is similar across the platforms we track. Xbox, PlayStation and PC all hover around the $20 mark. This number only includes in-game revenue related to a game (such as DLC, microtransactions and subscriptions) and does not include any premium revenue for games (such as buying a copy of a title for $60).
PlayStation’s ARPPU is slightly higher for the first nine months of this year. It is worth noting that the top five titles by revenue for Xbox and PlayStation are the same:
- Three paid sports titles with live-service elements
- A huge blockbuster single-player release
- A free-to-play game that is known for successfully pushing players to spend big on cosmetics (and battle passes)
Looking to see an exact list of top games by revenues per platform? Contact Us.
However, PlayStation also has several other single-player first-party experiences that bolstered revenues this year (Horizon Forbidden West and Gran Turismo 7), ultimately pushing PlayStation over the edge.
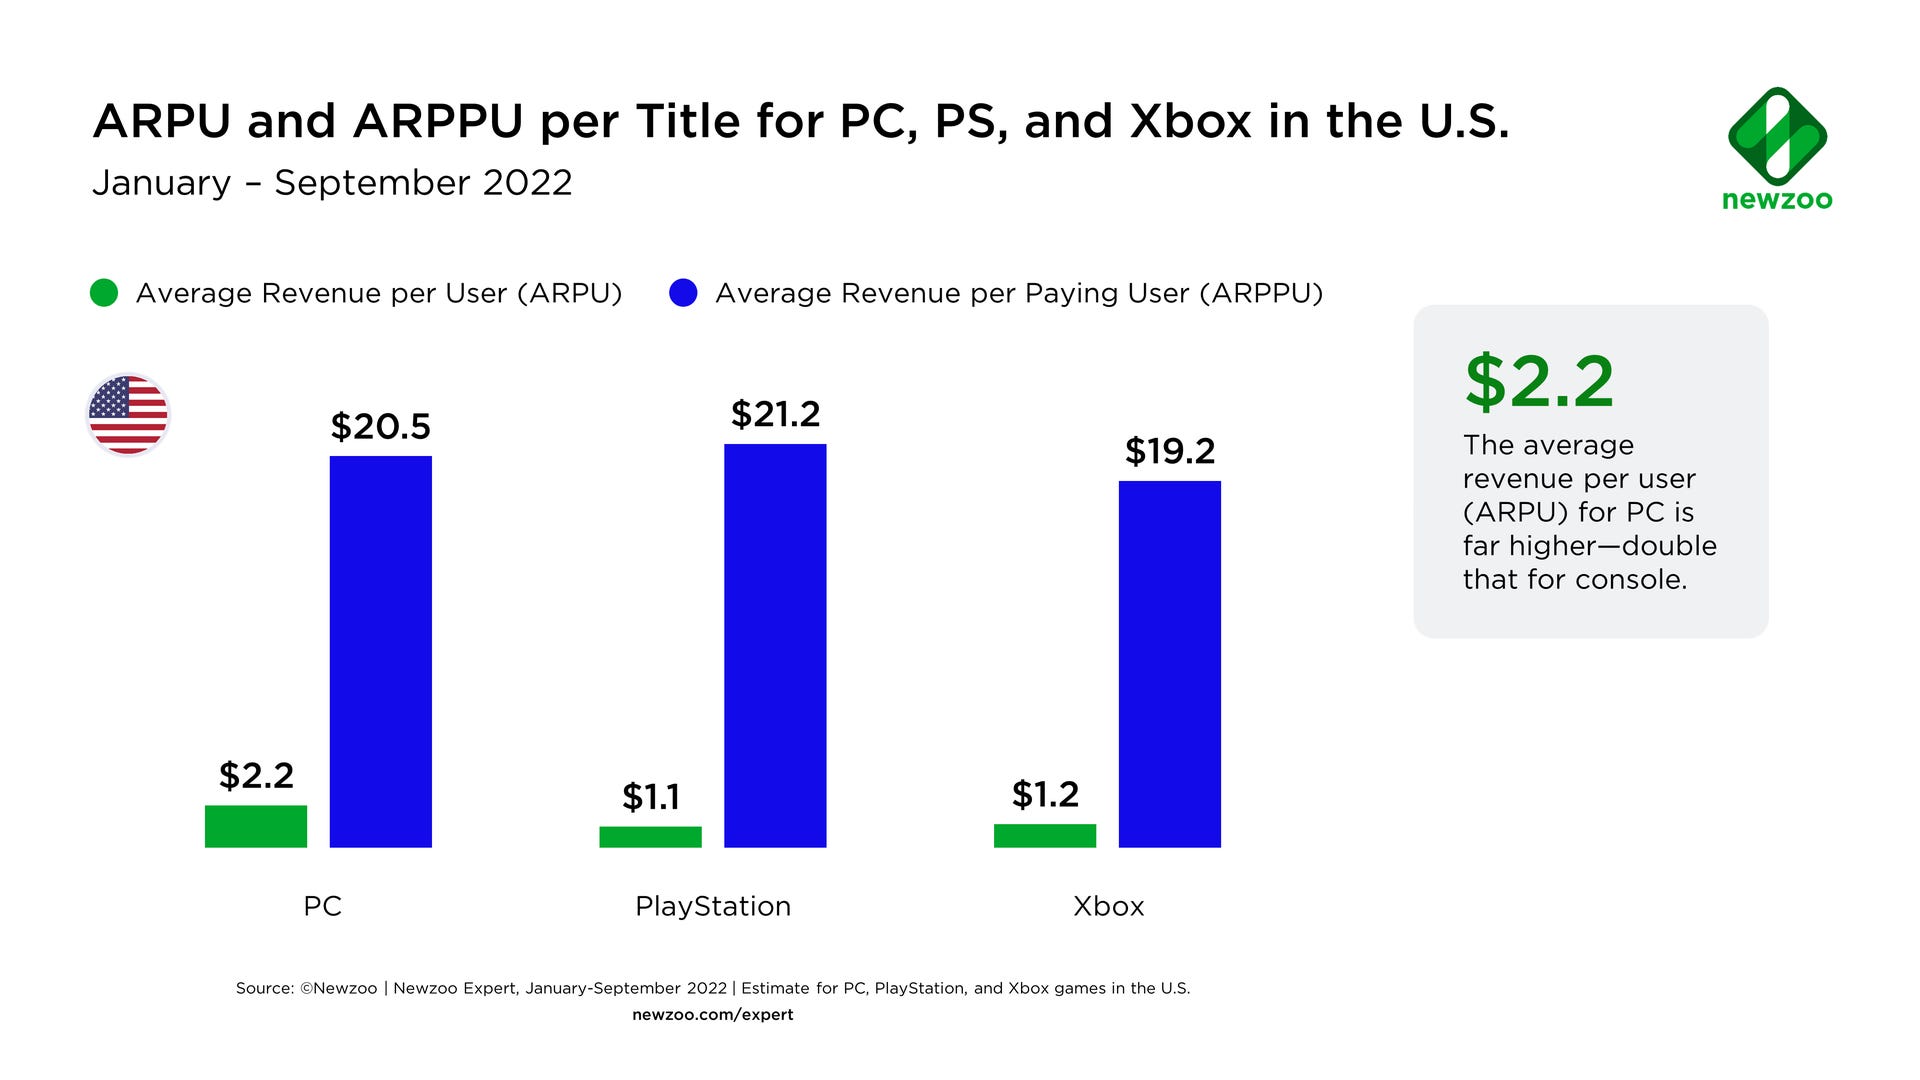
As you can see in the chart above, the average revenue per user (ARPU) is far higher for PC — double that of console users. This suggests that there are plenty more non-spenders (for software) on console than on PC.
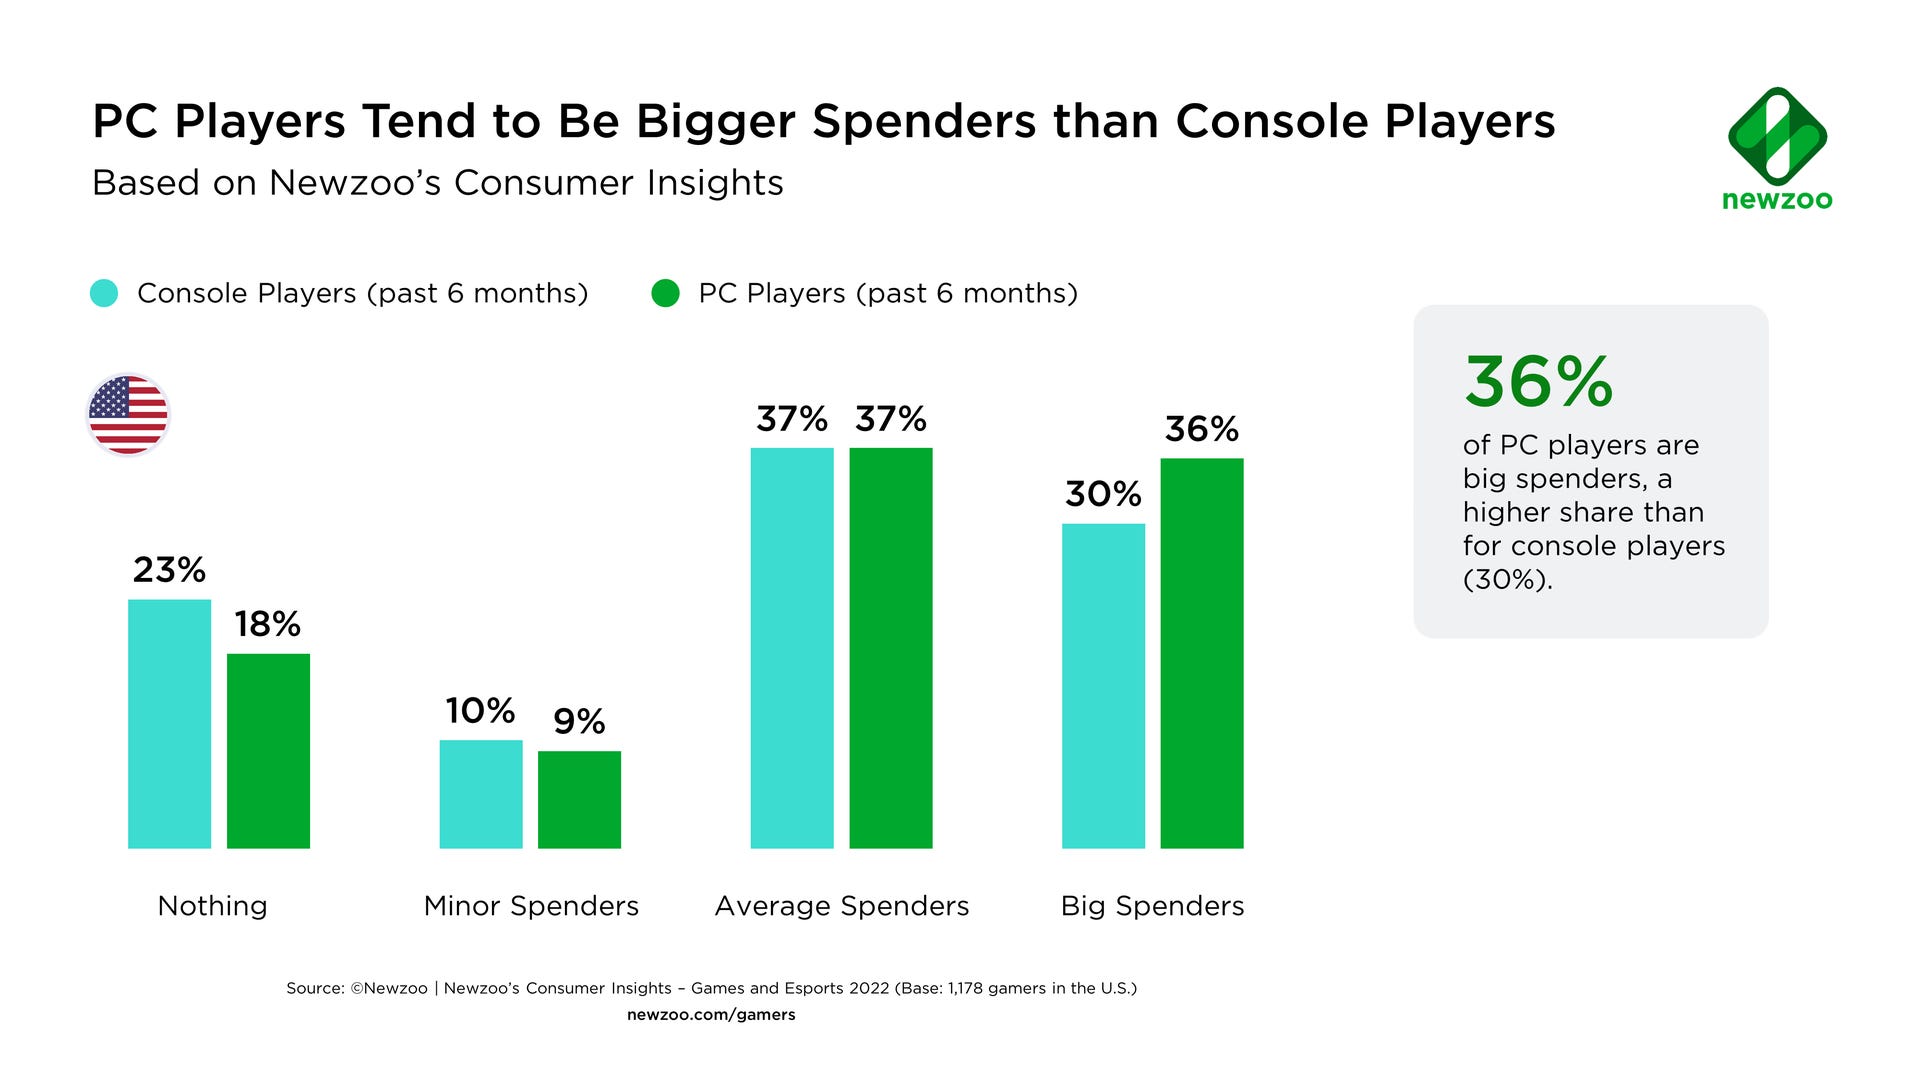
This sentiment is backed up by Newzoo’s Consumer Insights data. In our survey, we asked gamers how much they spent on games in the past six months. Around 23% of console players spent nothing vs 18% of PC gamers:
Also, console’s user base skews slightly younger and is therefore slightly less likely to spend its disposable income on games.
The personas in Newzoo’s Gamer Segmentation also shed some light on spending behavior. PC gamers in the US are more likely to fall into the Ultimate Gamer group, which spends big on games and engages heavily with all aspects of gaming.
Meanwhile, console players — especially those on PlayStation — are more likely to fall under the Mainstream Gamer group, who do not typically like to spend big on games (but many of them spend).
The sheer number of players in this group contributes to overall spending on console platforms. While PC has more big spenders, it also has more players who spend nothing and slightly fewer minor spenders.
Today’s most played games in the US leverage free-to-play monetization
Our Newzoo MAU (monthly active user) data for the US shows that the Top Ten games (for the first nine months of 2022) across PC and consoles have something in common: they leverage free-to-play monetization tactics.
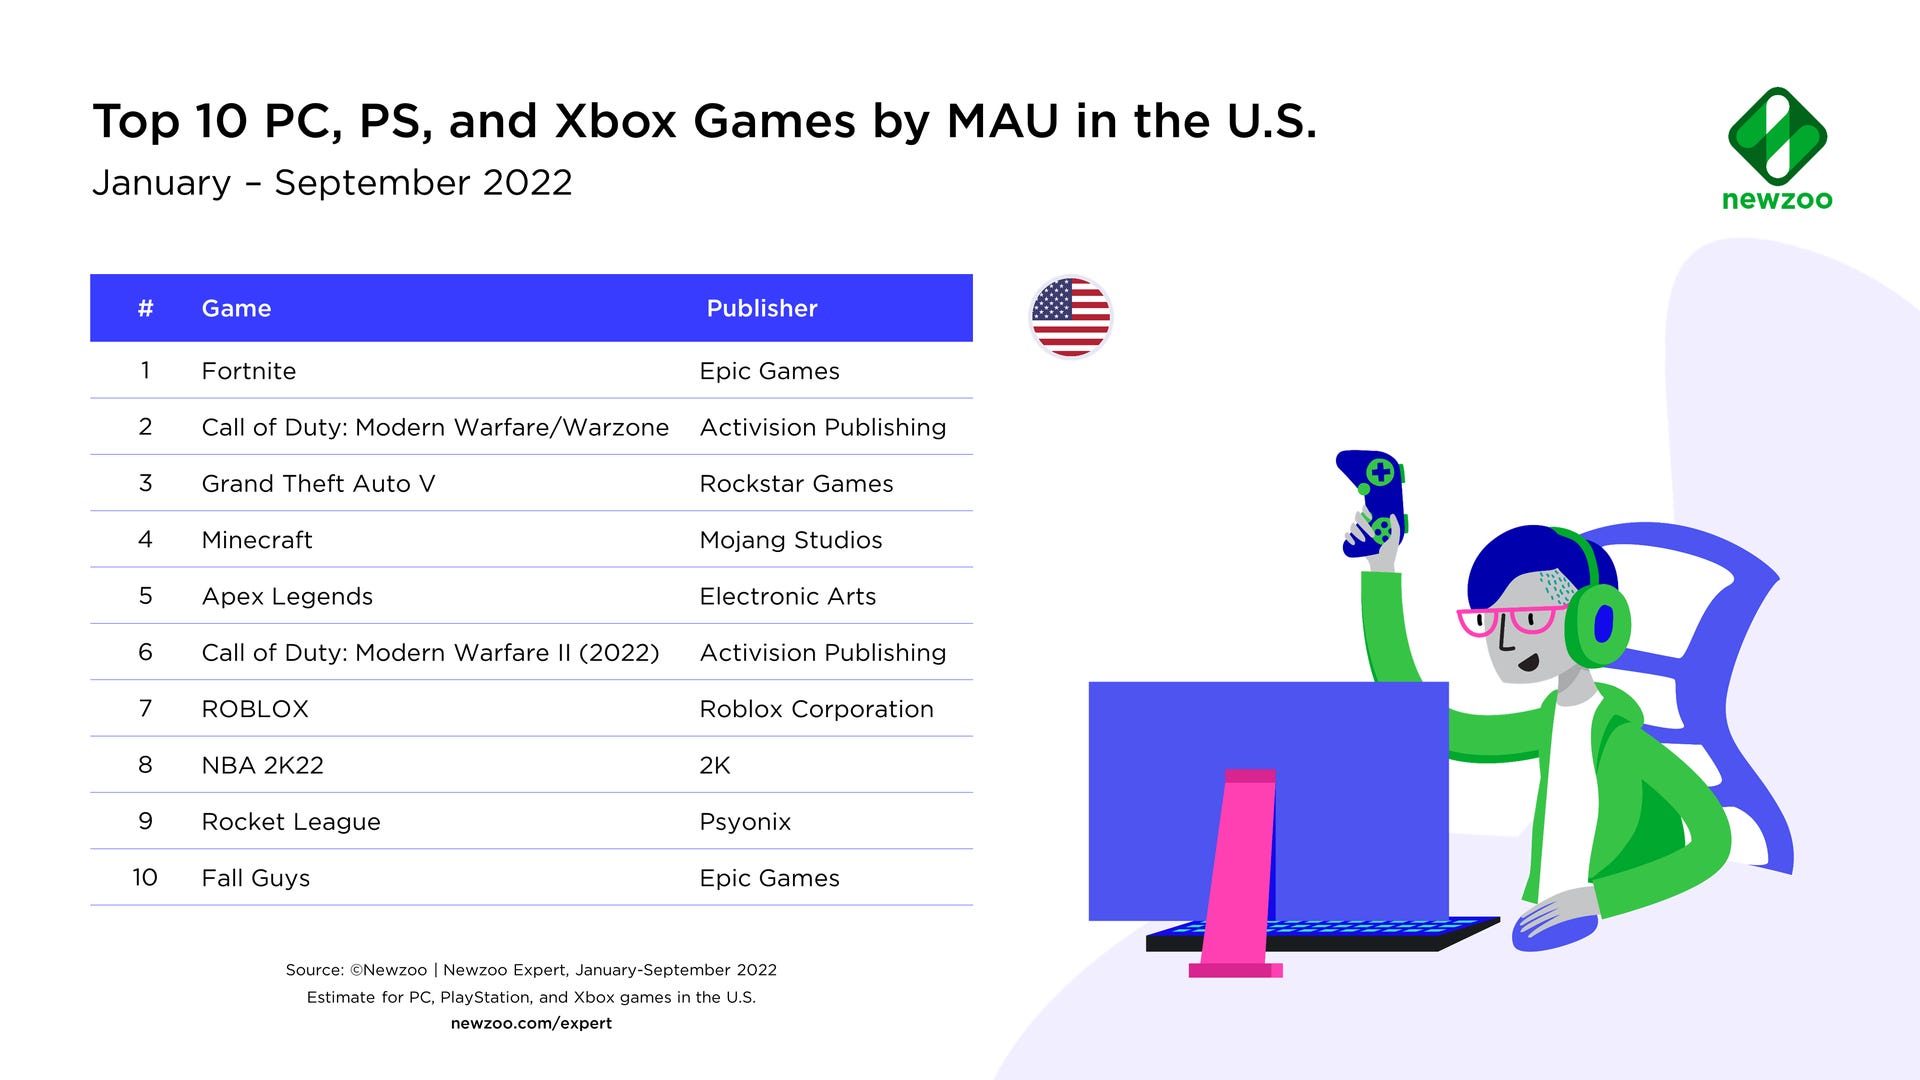
Fortnite, Call of Duty Warzone, Roblox, Apex Legends, Fall Guys and Rocket League are all free-to-play, removing barriers to entry and helping them amass huge audiences. Players pay for in-game cosmetics and battle passes in these titles.
Even the premium games in the US chart above — NBA 2K22 and GTA V — feature monetization methods common in free-to-play games.
High- and long-term engagement — backed up by robust monetization methods — typically leads to high and stable revenues. This is reflected in our revenue data.
Most game publishers understand this, but many lack deeper insights into what is working or not for competitors — especially for live-service games.
ARPPU and premium/recurring revenues split for different game genres on console and PC in the US
Looking at ARPPU for genres paints an interesting picture. The below image shows our ARPPU data for two very different popular genres on PC and console — battle royale and adventure.
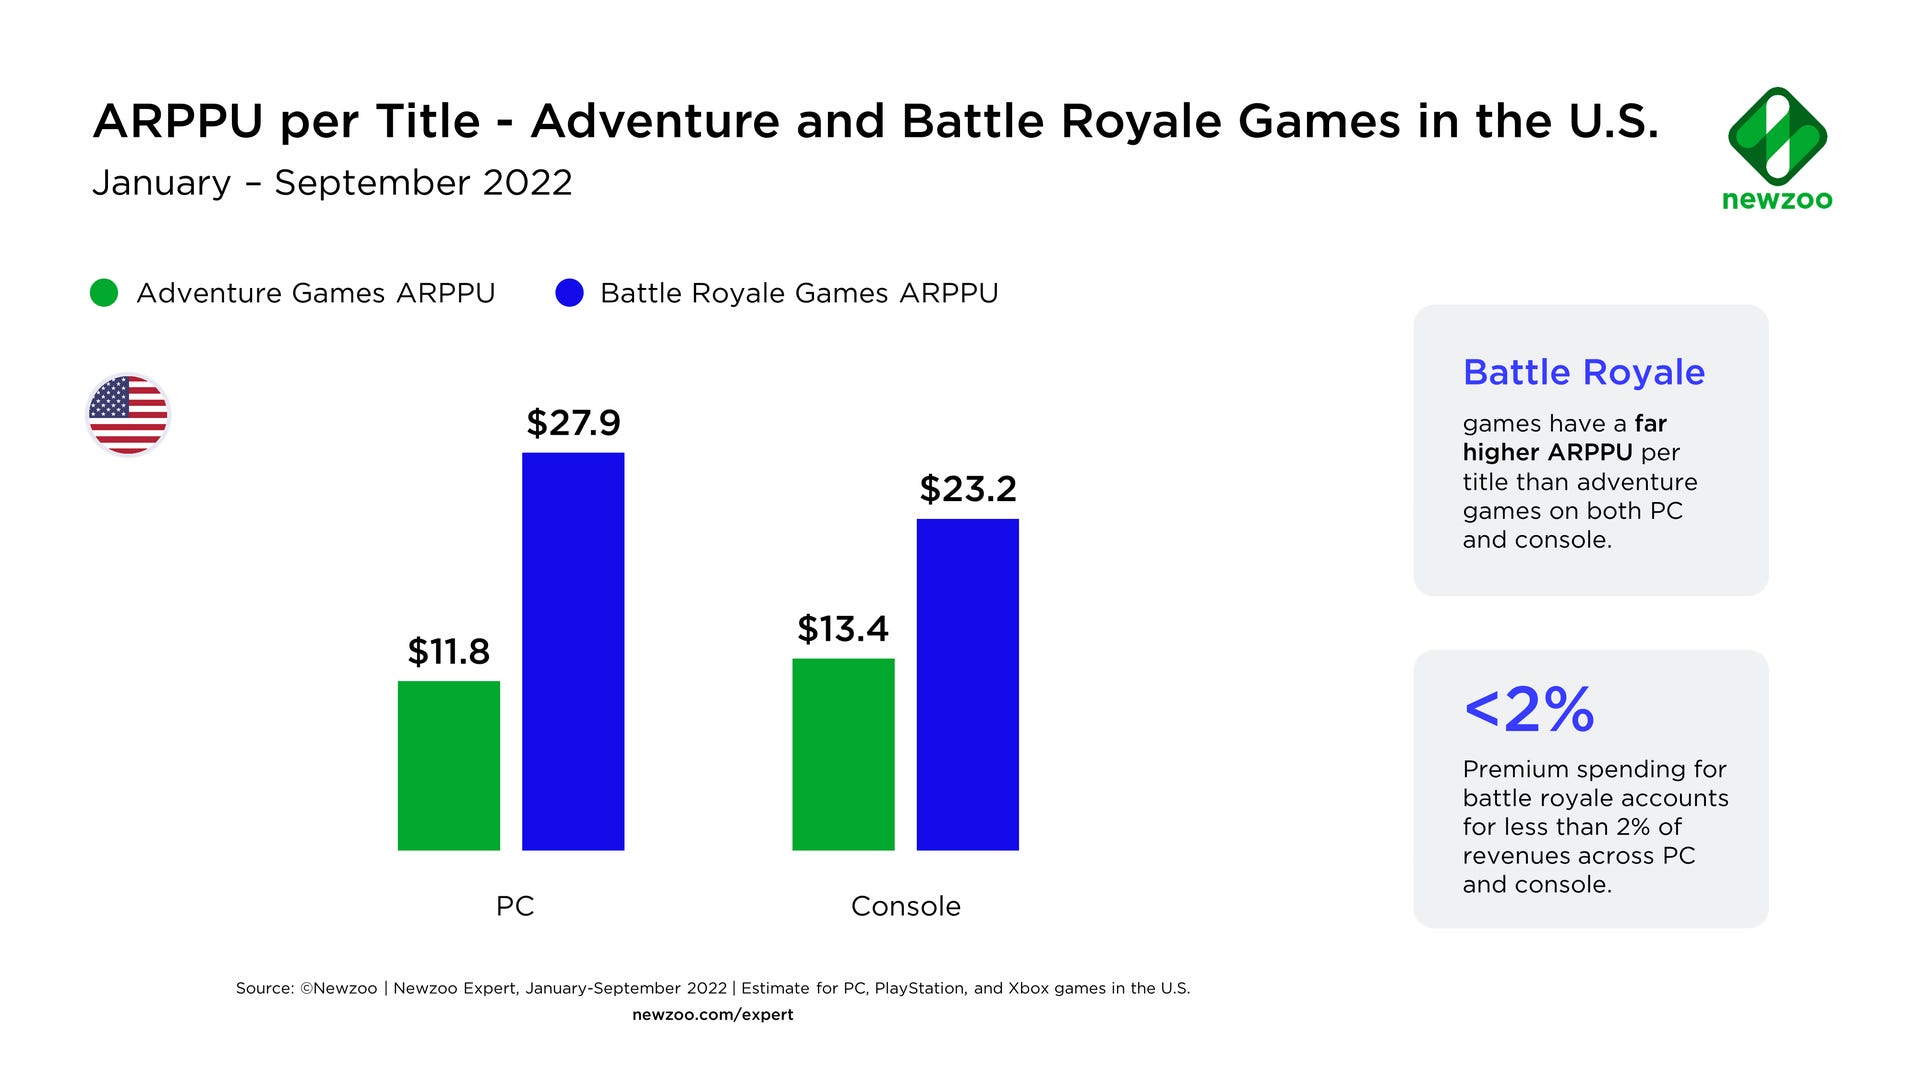
As you can see, battle royale games have a far higher ARPPU number, which is expected with so many titles in the genre being free-to-play and relying solely on in-game monetization. In fact, premium spending accounts for less than 2% of revenues across PC and console.
While all the top battle royale games are free-to-play (and gameplay is unaffected by spending), payers are still willing to spend a reasonable amount of money on in-game purchases.
Our deeper data in Newzoo Expert shows that most of these revenues are from in-game currency and cosmetics, but subscriptions (AKA battle passes) also contribute.
On the other end of the spectrum, adventure games have a lower ARPPU, but most of the genre’s revenues are premium (just under 90% on PC and 79% on console).
Assassin’s Creed DLC and spending in GTA Online was especially popular on console in the first three-quarters of 2022, which can explain why PC’s share of premium revenues is higher.
Sports titles, which have a more even share of spending from premium and in-game revenues, tend to have the best of both worlds, which is why franchises like FIFA, Madden and NBA 2K are so successful for EA and Take-Two.
These publishers and others are constantly refining their monetization strategies, bolstering their full-priced premium revenues with DLC, free-to-play monetization and subscriptions.
Competition is increasing in the games market, and hybrid monetization is helping many of the biggest publishers — but also medium and smaller game makers — hedge their bets for the future.
Many of these companies are already using the revenue data in Newzoo Expert to hone their monetization, keep an eye on competitor performance or figure out what kind of games they should focus on next.
The data we cover in this article is just the tip of the iceberg. The full suite of data for the US includes:
- Top game revenuer
- Rank history
- Revenues (premium and in-game/recurring)
- Recurring revenue split including microtransactions, DLC and subscription splits
- Average sale price (premium)
- Active to paying user conversion rate (in-game)
- ARPU (Average revenue per user, in-game)
- ARPPU (Average revenue per paying user, in-game)
And that's just the revenue data. Newzoo Expert also includes player engagement data, such MAUs (monthly active users) and DAUs (daily active users) for 37 games markets across the world.
Reach out to us here to learn more.