Do Steam's pre-launch wishlists and post-launch sales line up meaningfully?
GameDiscoverCo is back with more takeaways from its recent survey of Steam developers

The GameDiscoverCo game discovery newsletter is written by 'how people find your game' expert and GameDiscoverCo founder Simon Carless, and is a regular look at how people discover and buy video games in the 2020s.
So, we're back looking at our Steam survey data again. For those who missed it, we fielded an anonymous survey in August that got more than 75 responses from Steam devs/publishers, all for newer games that launched in 2019, 2020, or 2021.
Our first results from this data examined 'long tail' revenue for your Steam game, with some very useful top-line estimates. And our next survey results are looking at something everyone wants to know about. Initial sales compared to Steam wishlists at launch -- is there a provable relationship?
Steam wishlists compared to sales - does it track?
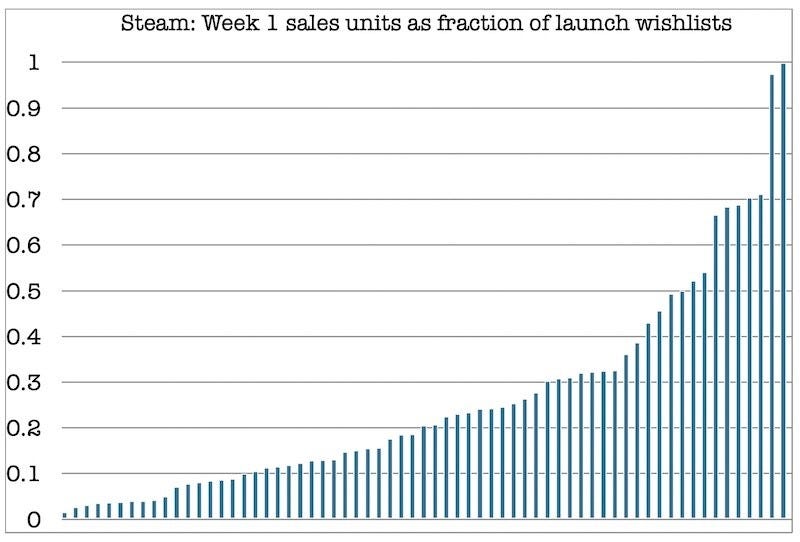
You may recall we surveyed this correlation for all ages of Steam games back in June 2020. On a broad basis, the answer we get this time is the same -- a game's first week unit sales have a median of 0.2x its total Steam wishlists at launch. The above graph is the full data set from our new survey, in ascending order.
If you look at the two 'battletested' spreadsheets we published recently -- from GameDiscoverCo and Fellow Traveller -- both of these use 0.2 (aka 20%) Week 1 sales as the most obvious option. So that's good news! But we really want to drill down on the possible range, because Week 1 sales on Steam span anything from 1.5% to 100+% percent of launch wishlists.
This is a crazily high range, given that the other things we survey -- like Week 1: Year 1 revenue multiples or even Steam units sold compared to number of reviews -- are often within a '3-fold' range (the highest likely result is three times the lowest). In this case, the highest likely result is 60+ times the lowest!
So it seems like the correlation is very loose across a large number of games, and you should not 'take your wishlists to the bank'. (You may have been aware, but this is further confirmation.)
Median unit sales for different amounts of wishlists?
However, we wanted to drill deeper and try to discover closer correlated elements in the data. And we did find some things. Here's the median Week 1 Steam unit sales, compared to the amount of wishlists a game launched with:
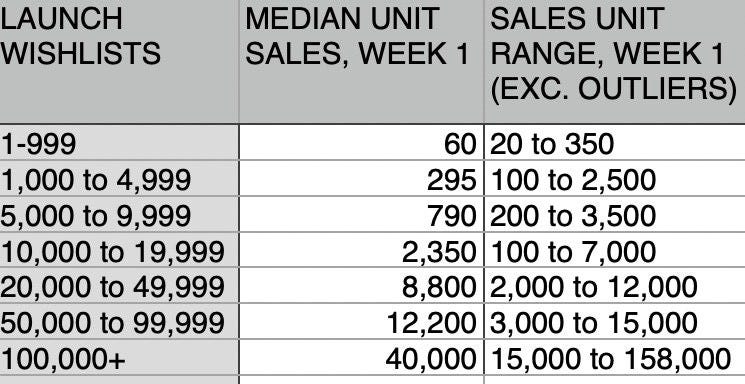
What's interesting here, if you look at ranges? Well, for games that have anything up to 20,000 wishlists at launch, you get an incredibly wide range of results, when excluding the top and bottom extreme outliers. (The maximum sales unit result is often 10x the minimum and the biggest range -- for 10k to 20k wishlists -- has the maximum sales as 70x the minimum, youch.)
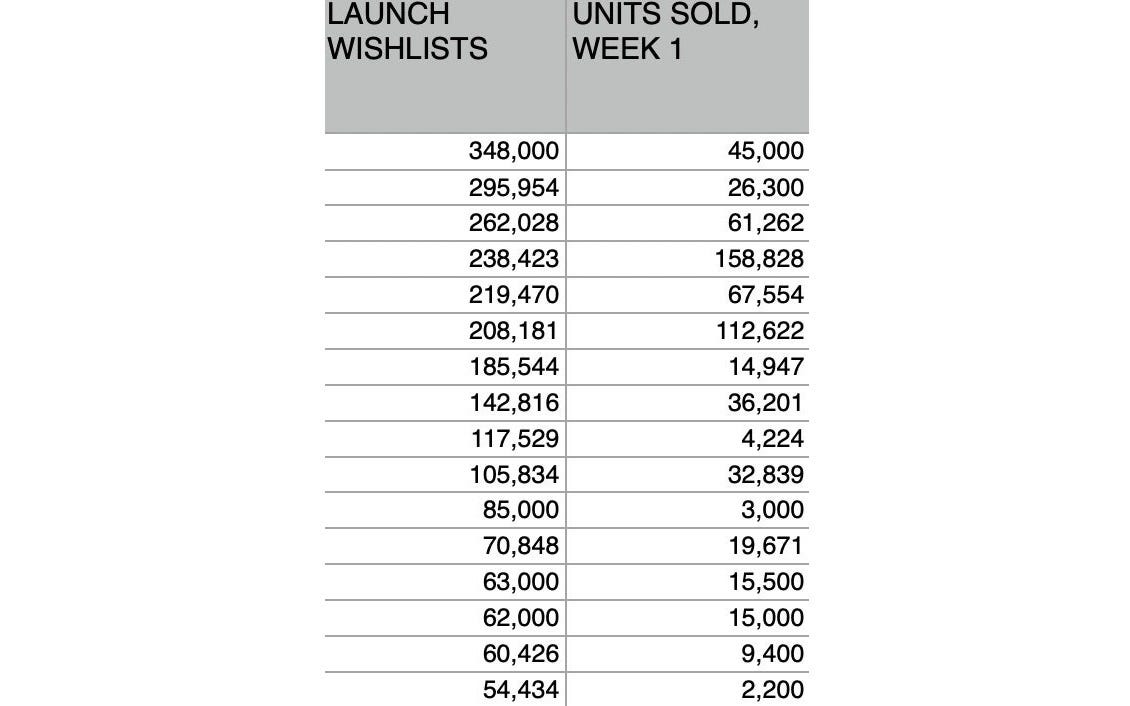
But for games with more than 20,000 Steam launch wishlists, things seem to narrow a bit. You can still get 'disappointing' conversion rates; there's a title in there with 85,000 wishlists that only sold 3,000 copies during launch week, for example. But the maximum is closer to 5x or 6x the minimum. This is not amazing, but slightly better correlated, in our semi-professional view.
We do have a relatively small amount of sample points here, of course. But here's a potential theory. We still think it's possible to juke your way to 10-20k Steam wishlists if you a) have your game on the site for a longer period of time b) release multiple demos, and c) appear in a bunch of pre-release 'features' -- and maybe even get in Popular Upcoming too.
And if you have 30k, 50k, or even 100k wishlists at launch? A bunch of players cared about you, independently of all of the marketing beats you had. So the extreme outliers go away. But frankly, it's still fairly all over the place. Here's all the results we got for games with more than 50,000 wishlists* at launch, for context:
Anyhow, I think this is all to say wishlists are a little bit predictive of how you may do at launch, but not a lot. Things that seem important that aren't encompassed within wishlists are: launch review scores (Very Positive?), streamer support at launch, are you in a genre that people like 'sampling' new games in, vs. playing one game constantly? Etcetera.
(*BTW: slight survey error: we asked devs to give us their total number of launch emails, not launch wishlists. As somebody pointed out, that initial email count will also include anyone who follows that game's publisher page, in addition to wishlisted the game. So the figures may be a bit inflated for 'bigger publisher' games. We'll ask for actual wishlists in the future!)
How about sales compared to 'organic' daily wishlists?
As you may know, I've been trying to focus on good quality 'organic' wishlists, suggesting that your daily wishlists when 'not much is going on' are a better indication of possible success than total wishlists.
We did try to ask our respondents this, across the 75-ish games released on Steam from 2019 to the present day. And here's the results:
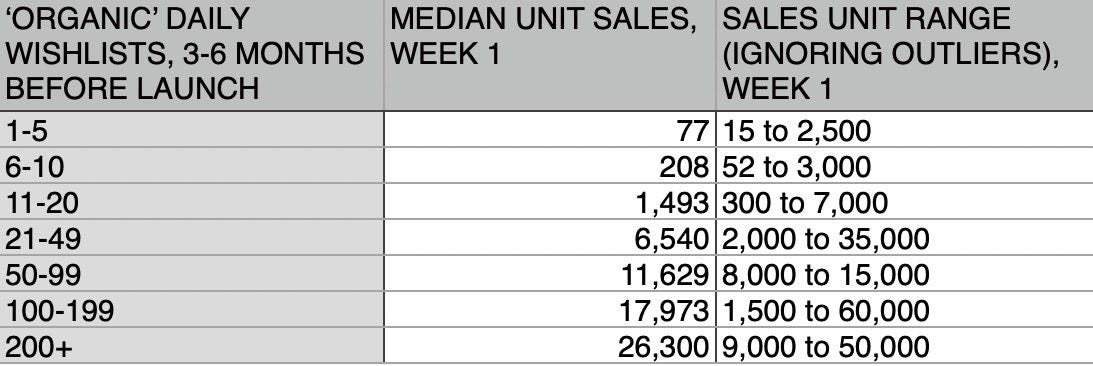
So more organic daily wishlists make for better median unit sales, sure. And it's interesting that no game with less than 10 organic daily wishlists got more than 3,000 units sold for launch week, I think. (A sobering stat, albeit from a smaller sample size.)
But how about the ranges? As you can see, the lower wishlist tiers are all over the place, with 'min to max' sales variances between 15x and 60x. And even 21-49 daily wishlists has a pretty large variance (17x). But over 50 organic wishlists per day, it does narrow down somewhat.
I also think that a few people didn't fully grok the (difficult to estimate!) question. We looked more closely in the '100 to 199 organic daily wishlists' bucket, and the two lowest results are from people who launched with less than 10k wishlists.
This seems impossible -- you would have more wishlists than that by launch. Without those, we currently see a range of 15,000 to 60,000 units in the first week for 100-199 organic daily wishlists. This is more like a 4x range.
Look, we just don't have enough data to do this question justice. But I still think higher organic daily wishlists (without demos, sales, and all that goodness) is a more reliable indicator of eventual Steam success than just 'total' wishlists for the majority of Steam games. (Even if the above data doesn't 100% prove that.)
As for how you get good organic daily wishlists? I do think this is down to having a great 'hook' and visual or conceptual angle on your game, being in the right genre or subgenre, releasing gameplay trailers and even demos/streamer versions early on to help hype.
But beyond that, it's like: why are some pop songs hits, and some flops? Some of this 'designing for success' can be irritatingly intangible. And if you could simply algorithm your way to success… I probably wouldn't be writing this newsletter, I'd be luxuriating in my palatial New Zealand panic bunker?
Finally for this section, I just wanted to highlight -- across the entire sample data -- the different results you can get for first week unit sales on Steam:
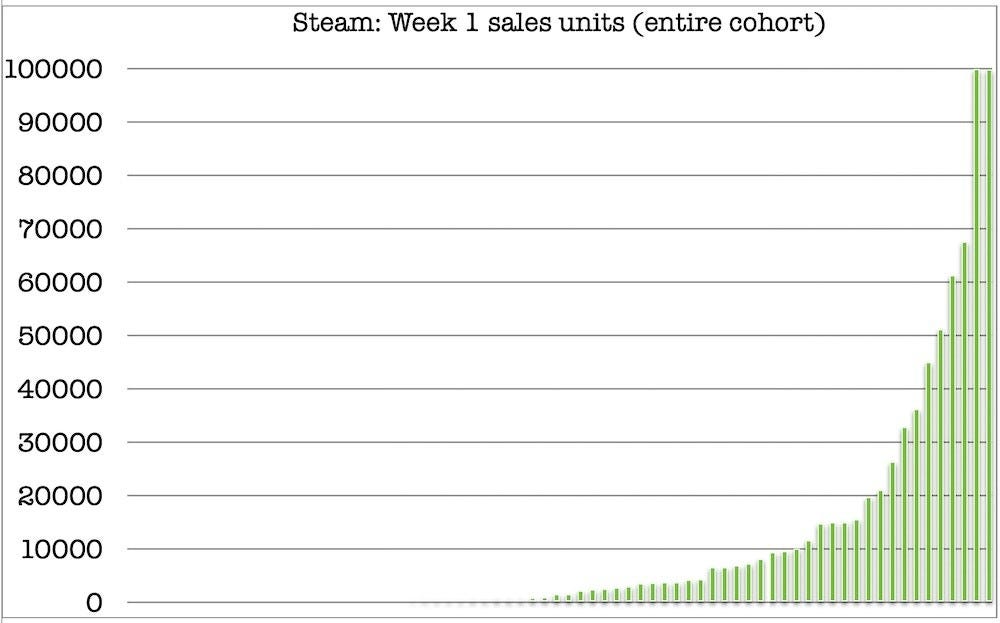
I tried mapping the above graph logarithmically, and it was a more easily viewable curve. But it didn't truly convey the sheer scale of the possible different outcomes for your Steam game.
So yes -- there are entries all the way from the left to the right of the graph, and you can only really start to see them about half-way across.
And… that's how selling games in the 2020s work on Steam. All humanity lives here, and there's a gigantic range of outcomes. We hope to do our part to get you to the right of this graph.
GameDiscoverCo is an agency based around one simple issue: how do players find, buy and enjoy your premium PC or console game? You can subscribe to GameDiscoverCo Plus to get access to exclusive newsletters, an eBook and a Discord, plus interactive daily rankings of every unreleased Steam game, and more besides.